Chart.js
用于现代网络的简单而灵活的 JavaScript 图表库
4.0 中的新功能 颜色插件
Chart.js 品牌颜色的默认调色板可作为内置的省时零配置插件使用。
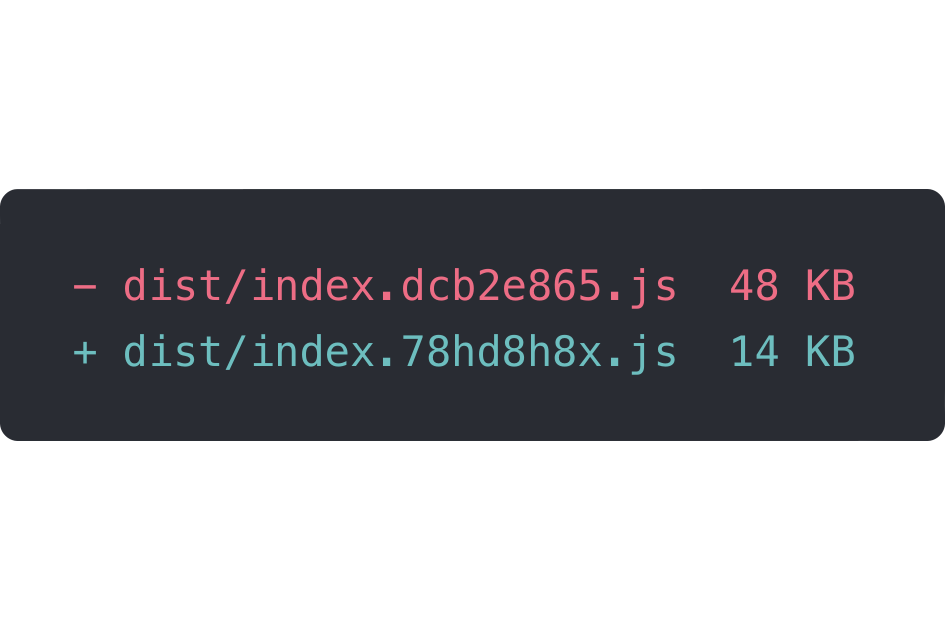
4.0 中的新功能 摇树优化
通过只注册必要的组件,JavaScript 包的大小可以减少几十 KB。
3.5 中的新功能 标尺堆叠
布局框可以分组堆叠和加权。
3.4 中的新功能 副标题插件
具有与主标题所有相同选项的副标题插件。
3.1 中的新功能 折线片段样式
折线片段可以根据任何用户定义的标准设置样式。
3.0 中的新功能 高级动画
每个元素中每个属性的转换都可以单独和独立地配置。
3.0 中的新功能 性能!
引入了许多性能增强功能。 此示例具有 1M (2x500k) 个点,并启用了新的抽取插件。
2.0 中的新功能 混合图表类型
混合搭配柱状图和折线图,以在数据集之间提供清晰的视觉区分。
2.0 中的新功能 新的图表轴类型
在日期时间、对数甚至完全自定义的标尺上轻松绘制复杂、稀疏的数据集。
2.0 中的新功能 动画一切!
更改数据、更新颜色和添加数据集时开箱即用的惊人过渡动画。

开源
Chart.js 是一个社区维护的项目,欢迎贡献!

8 种图表类型
以 8 种不同的方式可视化您的数据; 每个都是动画和可定制的。
HTML5 Canvas
跨所有现代浏览器 (IE11+) 的出色渲染性能。

响应式
在调整窗口大小时重新绘制图表以获得完美的比例粒度。